Whose Private-Sector Debt Will Implode Next: US, Canada, China, Eurozone, Japan?
Wolf Richter wolfstreet.com, www.amazon.com/author/wolfrichter
And private-sector debt, which includes household and business debts — how has it fared in the era of easy money?
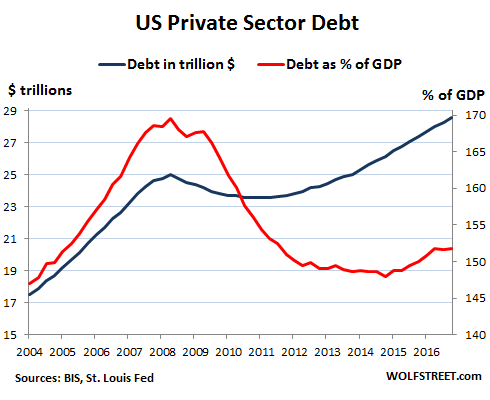
In the US, total debt to the private non-financial sector has ballooned to $28.5 trillion. That’s up 14% from the $25 trillion at the crazy peak of the Financial Crisis and up 63% from 2004.
In relationship to the economy, private sector debt soared from 147% of GDP in 2004 to 170% of GDP in the first quarter of 2008. Then it all fell apart. Some of this debt blew up and was written off. For a little while consumers and businesses deleveraged just a tiny little bit, before starting to borrow once again.
But the economy began growing again too, and debt as a percent of GDP fell to a low 148% in Q1 2015. It has since picked up steam, growing once again faster than the economy, and now is at 151.7% of GDP, back where it was in 2005. This chart shows US private sector debt to the non-financial sector, in trillion dollars (blue line, left scale) and as a percent of GDP (red line, right scale):
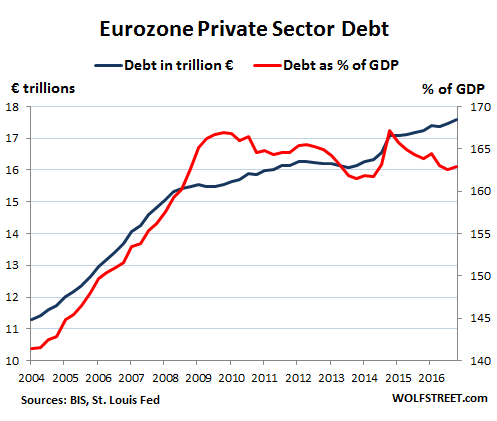
In the Eurozone, the pattern looks similar before the Financial Crisis, with total debt growing sharply both in euros and as a percent of GDP. But after the Financial Crisis, private-sector debt continued to grow in euro terms. As a percent of GDP, it largely leveled off, and as the economy picked up steam over the past two years, this debt declined to 163% of GDP:
These charts are based on data from the Bank for International Settlements and the St. Louis Fed.

SPONSORED CONTENT
Being hailed as the "ETF of Crypto" This stock has an all star advisory board even a “legendary investor”. Find out more
by Promethean Marketing Inc
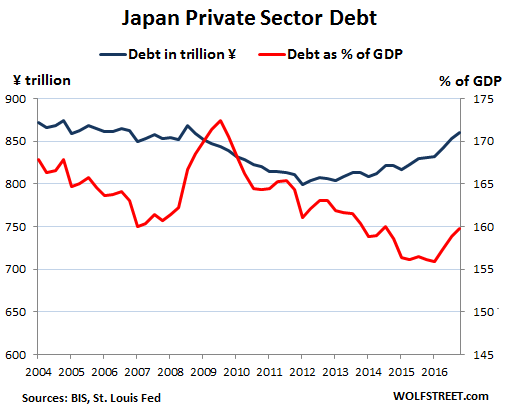
In Japan, private-sector debt declined over much of the period but over the last three years picked up a little. Debt as percent of GDP has zigzagged lower, though it recently bounced to 160% — higher than in the US but lower than in the Eurozone.
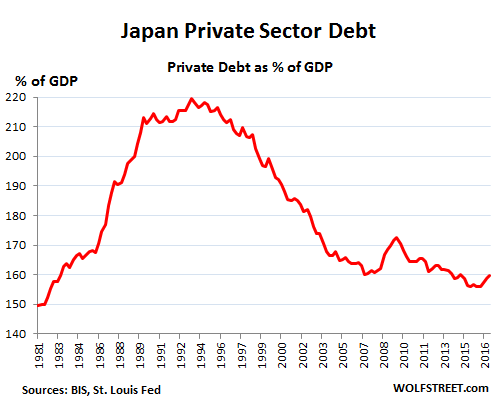
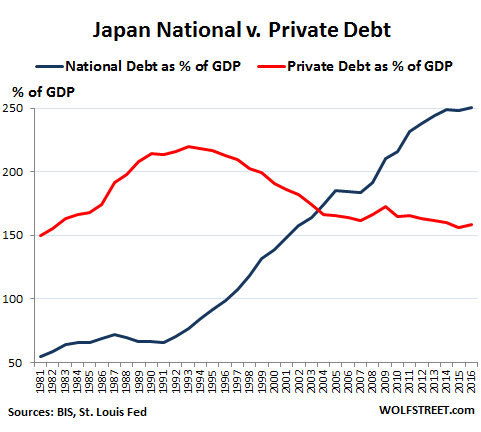
apan occupies a unique place in the developed world. The private sector experienced a phenomenal credit bubble in the 1980s, with debt peaking at 219.5% of GDP in Q3 of 1993. This private-sector credit bubble then imploded in a more or less orderly fashion over the next decades:
But as Japan’s private-sector debt bubble deflated, the government went on a gigantic no-holds-barred deficit-spending spree. As a consequence, the national debt skyrocketed from 55% of GDP in 1981 to 250% of GDP in 2017, by far the highest in the world. The Bank of Japan has been monetizing much of this debt under the guise of QE to keep it under control:
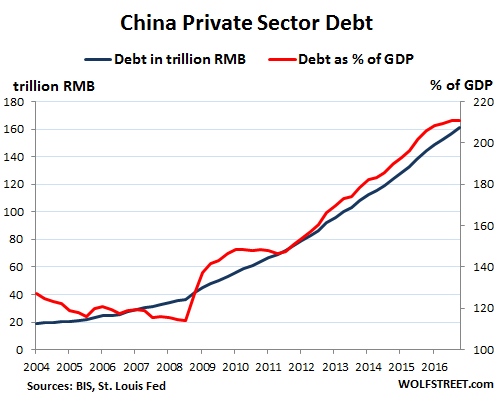
China is now where Japan was before its credit bubble blew up in the early 1990s. China’s private-sector debt – the part that has been officially acknowledged – surged from 20% of GDP in 2008 to 211% of GDP in 2017. This is the danger Zone where Japan got in trouble. It also assumes that China’s GDP numbers are not inflated. If GDP numbers are inflated, as many observers suspect, China’s private-sector debt as percent of GDP would be much higher:
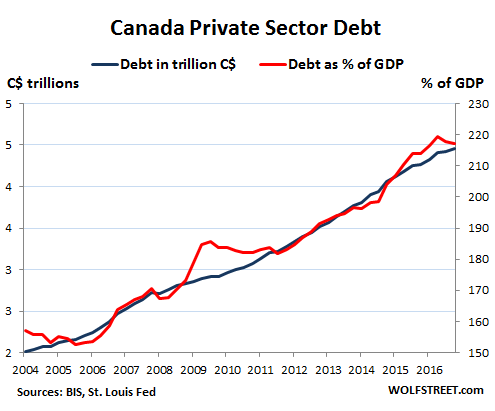
But wait, Canada rules! Private sector debt in Canada has more than doubled, from C$2.2 trillion in 2006 to C$4.5 trillion, and private sector debt as percent of GDP has soared to 217%, within a hair of where Japan was in Q3 1993, before the credit bubble imploded. Also note how eerily similar the charts for China’s debt and Canada’s debt are:
So Canada and China stand out in this group of debtor economies. The chart below shows private-sector debt as a percent of GDP with China (red) and Canada (black) up in their own universe, competing with each other to see whose debt will implode first. By comparison, the US, the Eurozone, and Japan look practically tame. Note how in 2008 Canada was right in the same neighborhood with the US, Japan, and the Eurozone:
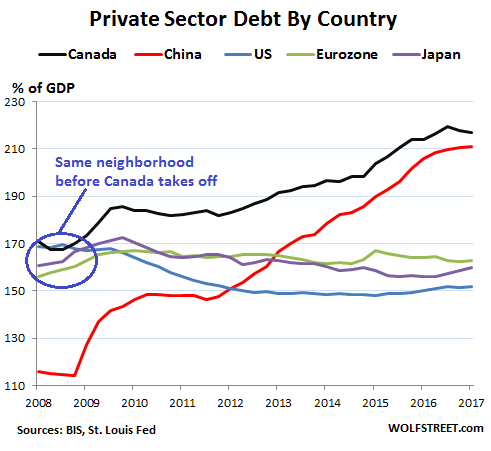
Within this group of economies, when it comes to the next private-sector-debt bubble implosion, there are really two places to look: Canada and China. In Canada households are on the hook, being among the most indebted in the world. In China, the debt binge has spread across businesses and households alike.
Thanks to: http://investmentwatchblog.com
Wolf Richter wolfstreet.com, www.amazon.com/author/wolfrichter
Canadians, fasten your seat-belt. Here are the charts.
The Financial Crisis in the US was a consequence of too much debt and too much risk, among numerous other factors, and the whole house of cards came down. Now, after eight years of experimental monetary policies and huge amounts of deficit spending by governments around the globe, public debt has ballooned. Gross national debt in the US just hit $20.5 trillion, or 105% of GDP. But that can’t hold a candle to Japan’s national debt, now at 250% of GDP.And private-sector debt, which includes household and business debts — how has it fared in the era of easy money?
In the US, total debt to the private non-financial sector has ballooned to $28.5 trillion. That’s up 14% from the $25 trillion at the crazy peak of the Financial Crisis and up 63% from 2004.
In relationship to the economy, private sector debt soared from 147% of GDP in 2004 to 170% of GDP in the first quarter of 2008. Then it all fell apart. Some of this debt blew up and was written off. For a little while consumers and businesses deleveraged just a tiny little bit, before starting to borrow once again.
But the economy began growing again too, and debt as a percent of GDP fell to a low 148% in Q1 2015. It has since picked up steam, growing once again faster than the economy, and now is at 151.7% of GDP, back where it was in 2005. This chart shows US private sector debt to the non-financial sector, in trillion dollars (blue line, left scale) and as a percent of GDP (red line, right scale):

In the Eurozone, the pattern looks similar before the Financial Crisis, with total debt growing sharply both in euros and as a percent of GDP. But after the Financial Crisis, private-sector debt continued to grow in euro terms. As a percent of GDP, it largely leveled off, and as the economy picked up steam over the past two years, this debt declined to 163% of GDP:

These charts are based on data from the Bank for International Settlements and the St. Louis Fed.

SPONSORED CONTENT
Being hailed as the "ETF of Crypto" This stock has an all star advisory board even a “legendary investor”. Find out more
by Promethean Marketing Inc
In Japan, private-sector debt declined over much of the period but over the last three years picked up a little. Debt as percent of GDP has zigzagged lower, though it recently bounced to 160% — higher than in the US but lower than in the Eurozone.

apan occupies a unique place in the developed world. The private sector experienced a phenomenal credit bubble in the 1980s, with debt peaking at 219.5% of GDP in Q3 of 1993. This private-sector credit bubble then imploded in a more or less orderly fashion over the next decades:

But as Japan’s private-sector debt bubble deflated, the government went on a gigantic no-holds-barred deficit-spending spree. As a consequence, the national debt skyrocketed from 55% of GDP in 1981 to 250% of GDP in 2017, by far the highest in the world. The Bank of Japan has been monetizing much of this debt under the guise of QE to keep it under control:

China is now where Japan was before its credit bubble blew up in the early 1990s. China’s private-sector debt – the part that has been officially acknowledged – surged from 20% of GDP in 2008 to 211% of GDP in 2017. This is the danger Zone where Japan got in trouble. It also assumes that China’s GDP numbers are not inflated. If GDP numbers are inflated, as many observers suspect, China’s private-sector debt as percent of GDP would be much higher:

But wait, Canada rules! Private sector debt in Canada has more than doubled, from C$2.2 trillion in 2006 to C$4.5 trillion, and private sector debt as percent of GDP has soared to 217%, within a hair of where Japan was in Q3 1993, before the credit bubble imploded. Also note how eerily similar the charts for China’s debt and Canada’s debt are:

So Canada and China stand out in this group of debtor economies. The chart below shows private-sector debt as a percent of GDP with China (red) and Canada (black) up in their own universe, competing with each other to see whose debt will implode first. By comparison, the US, the Eurozone, and Japan look practically tame. Note how in 2008 Canada was right in the same neighborhood with the US, Japan, and the Eurozone:

Within this group of economies, when it comes to the next private-sector-debt bubble implosion, there are really two places to look: Canada and China. In Canada households are on the hook, being among the most indebted in the world. In China, the debt binge has spread across businesses and households alike.
Thanks to: http://investmentwatchblog.com


 Sat Mar 23, 2024 11:33 pm by globalturbo

