The Data Missing from Wall Street Economists: Skyrocketing Disabilities and Injuries in U.S. Workforce After COVID-19 “Vaccines”
by Brian Shilhavy
Editor, Health Impact News
The word “unprecedented” is being used more and more in financial news stories these days to describe the economy, and on financial news sites you can often read articles describing the same thing, but interpreting the data in completely opposite ways.
Take the “jobs market” data which has been the focus of many financial news stories this week. Depending on which articles you read on the same website, the data that is being released this week on jobs and unemployment either means the labor market is in decline, or that it is “too strong.”
A recent survey published on “investor-satisfaction” led to an article published this week stating that “Investors are mad as hell at advisers.”
Well, one reason why financial “experts” might be having such a hard time interpreting the current economic data is that certain topics are politically incorrect to discuss, and perhaps the biggest topic that nobody in the corporate media wants to address is the topic of deaths and injuries due to the roll-out of the COVID-19 “vaccines” in 2021.
If a reporter at any of the corporate news outlets even hints at the possibility that the COVID “vaccines” are killing and disabling people, their career would be pretty much over.
But if one does not factor in how many people were either removed from the labor force due to vaccine deaths, or are injured and disabled from the COVID shots, how can you accurately interpret the economic data??
Edward Dowd and his team at Phinance Technologies seem to be the only ones spending time crunching this data and publishing it, and Dowd recently wrote what the CONSERVATIVE estimates are at this point from evaluating the data:
No wonder Wall Street analysts are having such a difficult time interpreting the economic data, and often publishing contradictory information: they are missing this key data that Dowd provides, but which is politically incorrect to even acknowledge, let alone analyze.Using the conservative numbers from our vaccine damage report for US and assuming globally that 5 billion were vaccinated here are extrapolated estimated human costs globally:
Deaths: ~5 million
Disabilities: ~46.5 million
Injuries: ~900 million
These groups are not static.
And one of the most amazing things here is that Edward Dowd is providing the data that his team has collected to the whole world for FREE!!
Bureau of Labor Statistics (BLS) Reports
Here are some highlights from [url=http://www.phinancetechnologies.com/HumanityProjects/US Disabilities - Part1.htm]Phinance Technologies[/url] regarding disability rates based on data from the Bureau of Labor Statistics (BLS).Total population disability statistics
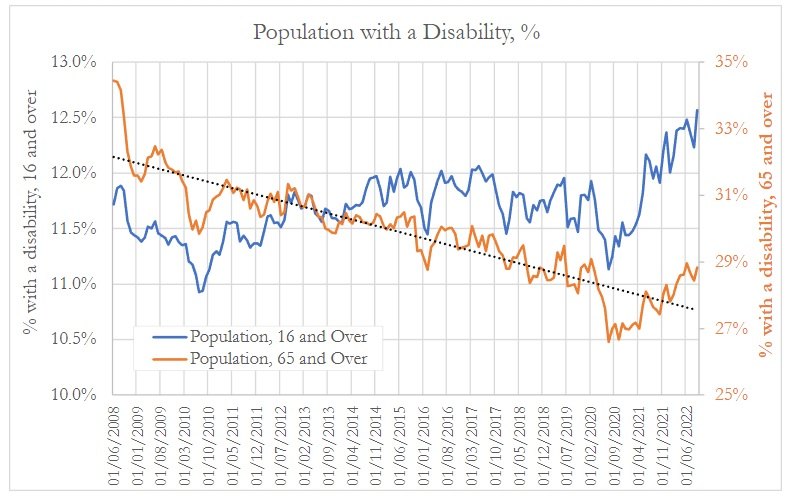
- Declining trend in disabilities in population over 65 years from 2008 to 2019 (general trend in improvement in health conditions).
- Trend was broken in 2020 with a sharp decline in disabilities at the onset of the pandemic lockdowns. This is unlikely to be due solely to a decrease in the rate of acquiring disability, especially in the older population for whom lockdown is less of a protective factor from risky activities such as sports and car accidents. It is therefore likely due to:
- Under-diagnosis of disabilities acquired during these months, due to reduced access to healthcare services.
- Disproportionate impact of COVID deaths on those with disabilities, especially the older disabled population most vulnerable to COVID, as well as other deaths hastened by lack of access to healthcare, or unwillingness to engage with healthcare services due to perceived risk of COVID.
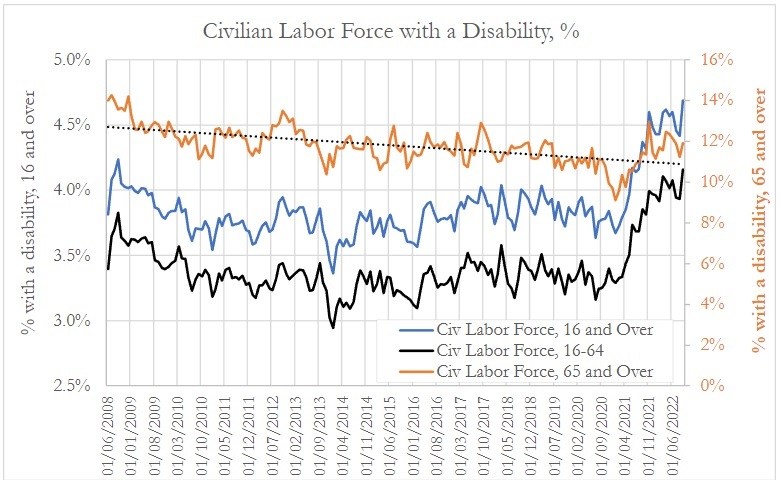
Civilian labor force with disabilities, all age-groups
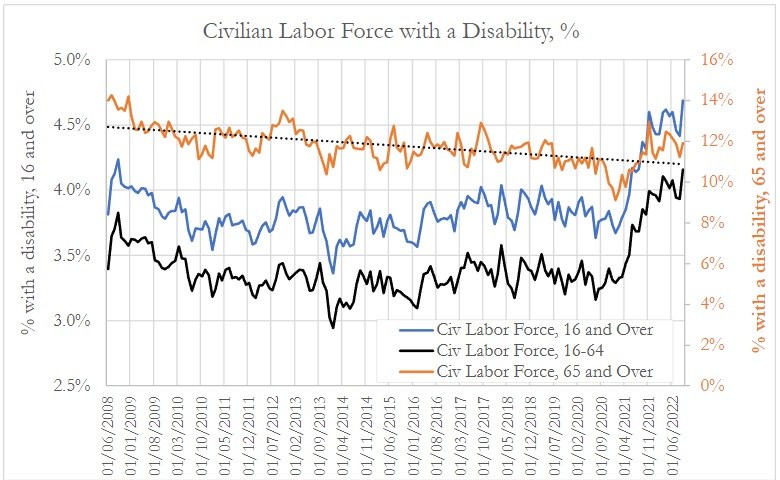
- We observe that the trend in disabilities in labor force 65+ from 2008 to 2019 in declining albeit at a slower rate than the improvement in general population.
- For the workforce aged 16 and over or 16 to 64 years, we do not observe a noticeable drop in disabilities in 2020 which we observed in the overall population. Why was there no noticeable effect of the reduction in exposure to risky activities in the workforce? No effect of lockdowns or less mobility?
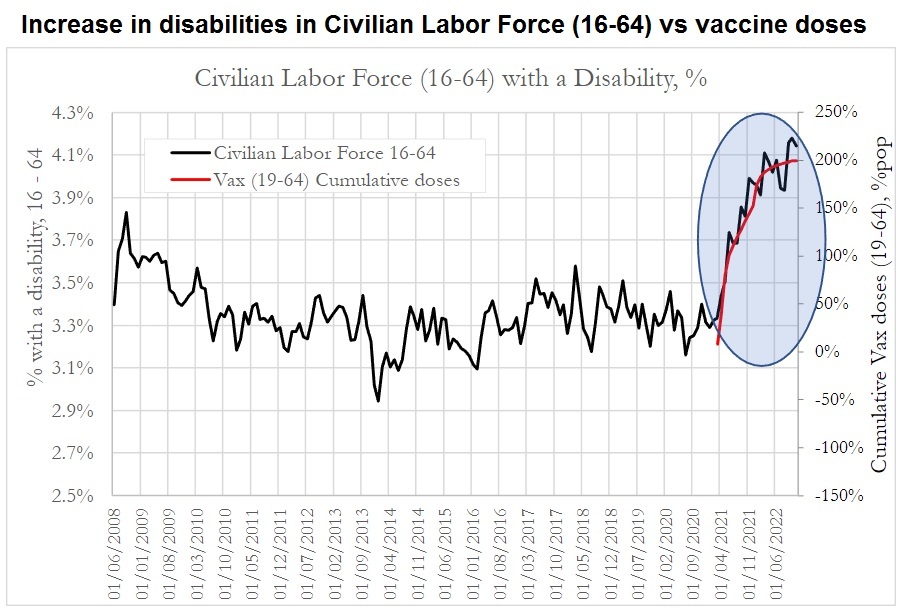
- We also observe a very noticeable rise in disabilities starting around 5/2021. For the 16-64 workforce this corresponded to a rise from 3.4% in 4/2021 to 4.2% in 9/2022, corresponding to a 23.5% rise.
- This is likely due to a combination of factors, including delayed diagnosis of disabilities acquired during lockdown, Long COVID syndrome, return to more normal economic activity (with inherent risk of injury), and vaccination impacts.
Civilian labor force with disabilities, by gender, 16 to 64 years
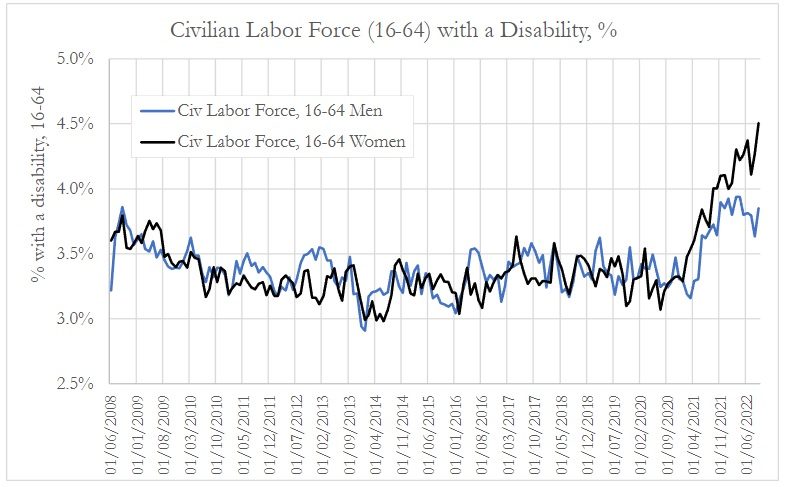
- For the 16-64 workforce also observe a very noticeable rise in disabilities starting around 5/2021 for both Men and Women. However, as we can clearly the rise in disabilities is much larger in Women than Men.
- For Women, the rise in disabilities went from a long-term average of about 3.3% in 4/2021 to 4.5% in 9/2022, corresponding to a 36.4% rise.
- For Men, the rise in disabilities went from a long-term average of about 3.3% in 4/2021 to 3.8% in 9/2022, corresponding to a 15% rise.
Employed with a disability
The employed population correspond to the civilian labor force that is currently employed. This population tends to be slightly healthier than the civilian labor force, with a lower disability rate.
- We observe that the trend in disabilities in employed population aged 65+ from 2008 to 2019 is declining, but at a slower rate than the improvement in general population.
- The sharper decrease in the percentage of employed 65 years and over with a disability from around 9/2020:
- May represent disproportionate loss of jobs for disabled older people compared with non-disabled older people, or difficulty competing with non-disabled people in the labor market during the economic rebound.
- Withdrawal of pandemic-related enhanced social security benefits which may have kept some disabled older people in work during the earlier lockdowns in spite of worsening disability.
Employed with a disability, by gender, 16 to 64 years
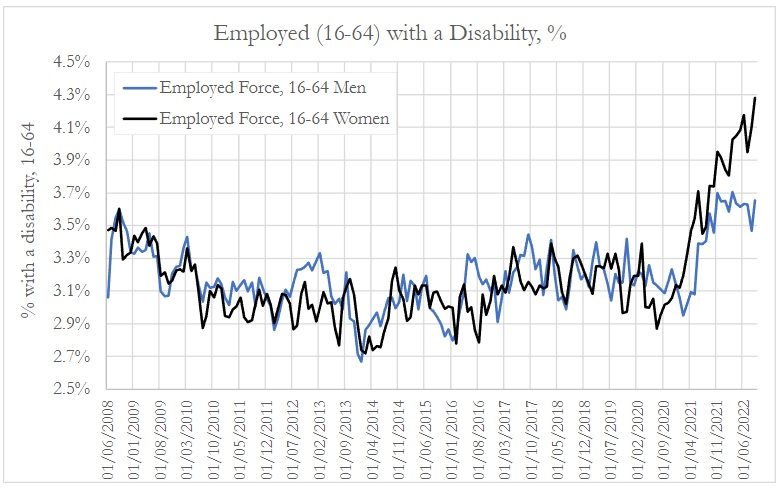
- For the employed 16-64 age group, we also observe a very noticeable rise in disabilities starting around 5/2021 for both Men and Women. However, as we can clearly the rise in disabilities is much larger in Women than Men.
- For Women, the rise in disabilities went from a long-term average of about 3.1% in 4/2021 to 4.3% in 9/2022, corresponding to a 38.7% rise.
- For Men, the rise in disabilities went from a long-term average of about 3.1% in 4/2021 to 3.7% in 9/2022, corresponding to a 19.3% rise.
Look at the full data at [url=http://www.phinancetechnologies.com/HumanityProjects/US Disabilities - Part1.htm]Phinance Technologies[/url].
Some may ask, since these statistics come from government sources at the Bureau of Labor Statistics, wouldn’t they be reflected in the government’s job data reports as well?
Not necessarily.
Government statistics on employment and unemployment data are not based on hard facts, but rather on estimates provided by surveys.
On the Bureau of Labor Statistics website is a page titled “How the Government Measures Unemployment“:
What might this survey not cover?Where do the statistics come from?
Early each month, the Bureau of Labor Statistics (BLS) of the U.S. Department of Labor announces the total number of employed and unemployed people in the United States for the previous month, along with many characteristics about them. These figures, particularly the unemployment rate—which tells you the percentage of the labor force that is unemployed—receive wide coverage in the media.
Some people think that to get these figures on unemployment, the government uses the number of people collecting unemployment insurance (UI) benefits under state or federal government programs. But some people are still jobless when their benefits run out, and many more are not eligible at all or delay or never apply for benefits. So, quite clearly, UI information cannot be used as a source for complete information on the number of unemployed.
Other people think that the government counts every unemployed person each month. To do this, every home in the country would have to be contacted—just as in the population census every 10 years. This procedure would cost way too much and take far too long to produce the data. In addition, people would soon grow tired of having a census taker contact them every month, year after year, to ask about job-related activities.
Because unemployment insurance records relate only to people who have applied for such benefits, and since it is impractical to count every unemployed person each month, the government conducts a monthly survey called the Current Population Survey (CPS) to measure the extent of unemployment in the country.
There are about 60,000 eligible households in the sample for this survey. This translates into approximately 110,000 individuals each month… (Source.)
Well, one thing we definitely know it does not cover is whether or not the person who was previously employed has now died.
Dead people don’t talk, and they can’t answer survey questions.
I did a page search for “death” on this BLS page, and it returned no cases of “death” in their explanation of how the government measures unemployment. My guess is that since historically death rates have been very static, and not deviating much from year to year, that the BLS does not take this into account.
We do know that the BLS tracks disabilities, as the data from Phinance Technologies clearly shows, but we can be fairly certain that the BLS does not track COVID vaccination status.
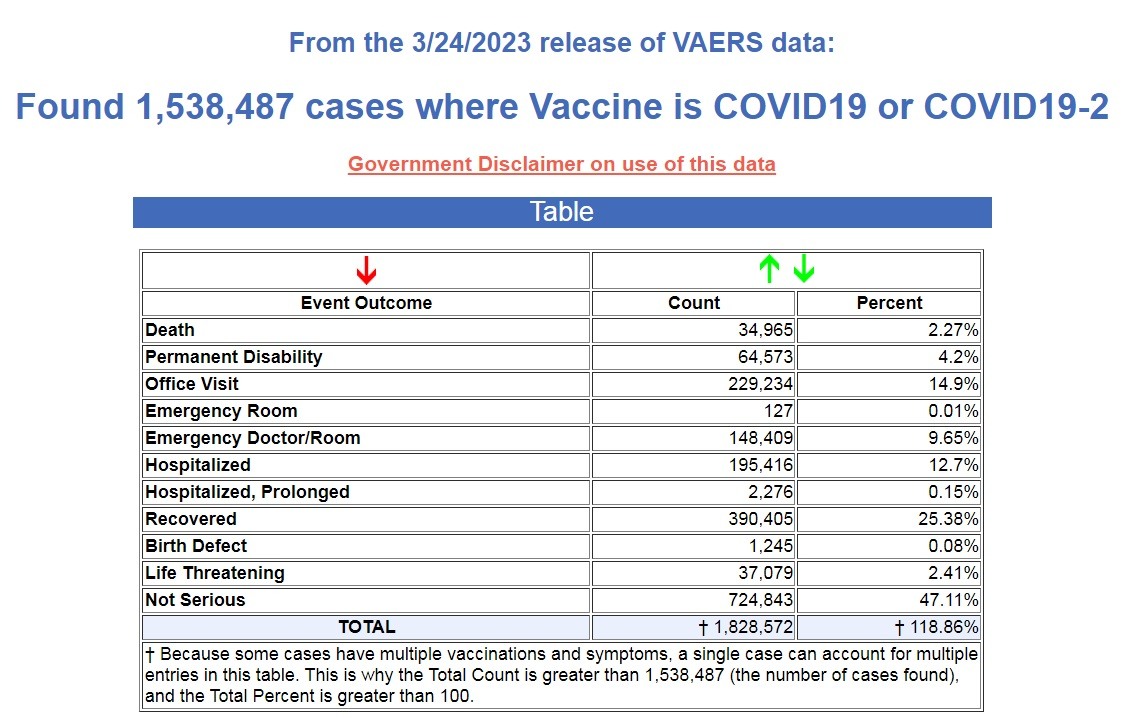
What we do know, however, from government-supplied data in the Vaccine Adverse Event Reporting System (VAERS) database, is that 1,538,487 people have reported injuries following COVID-19 injections, including 34,965 deaths, along with 64,573 permanent disabilities, and that these reported numbers represent less than 1% of the total number of deaths and injuries. (Source.)
That is more than 3x the amount of disabilities and deaths reported following vaccinations from all other non-COVID vaccines from the previous 30+ years before the emergency authorized COVID shots started in December of 2020. (=6VAX-F&VAX[]=ADEN&VAX[]=ADEN_4_7&VAX[]=ANTH&VAX[]=BCG&VAX[]=CEE&VAX[]=CHOL&VAX[]=DF&VAX[]=DPIPV&VAX[]=DPP&VAX[]=DT&VAX[]=DTAP&VAX[]=DTAPH&VAX[]=DTAPHEPBIP&VAX[]=DTAPIPV&VAX[]=DTAPIPVHIB&VAX[]=DTIPV&VAX[]=DTOX&VAX[]=DTP&VAX[]=DTPHEP&VAX[]=DTPHIB&VAX[]=DTPIHI&VAX[]=DTPIPV&VAX[]=DTPPHIB&VAX[]=DTPPVHBHPB&VAX[]=EBZR&VAX[]=FLU(H1N1)&VAX[]=FLU3&VAX[]=FLU4&VAX[]=FLUA3&VAX[]=FLUA4&VAX[]=FLUC3&VAX[]=FLUC4&VAX[]=FLUN(H1N1)&VAX[]=FLUN3&VAX[]=FLUN4&VAX[]=FLUR3&VAX[]=FLUR4&VAX[]=FLUX&VAX[]=FLUX(H1N1)&VAX[]=H5N1&VAX[]=HBHEPB&VAX[]=HBPV&VAX[]=HEP&VAX[]=HEPA&VAX[]=HEPAB&VAX[]=HEPATYP&VAX[]=HIBV&VAX[]=HPV2&VAX[]=HPV4&VAX[]=HPV9&VAX[]=HPVX&VAX[]=IPV&VAX[]=JEV&VAX[]=JEV1&VAX[]=JEVX&VAX[]=LYME&VAX[]=MEA&VAX[]=MEN&VAX[]=MENB&VAX[]=MENHIB&VAX[]=MER&VAX[]=MM&VAX[]=MMR&VAX[]=MMRV&VAX[]=MNC&VAX[]=MNQ&VAX[]=MNQHIB&VAX[]=MU&VAX[]=MUR&VAX[]=OPV&VAX[]=PER&VAX[]=PLAGUE&VAX[]=PNC&VAX[]=PNC10&VAX[]=PNC13&VAX[]=PNC15&VAX[]=PNC20&VAX[]=PPV&VAX[]=RAB&VAX[]=RUB&VAX[]=RV&VAX[]=RV1&VAX[]=RV5&VAX[]=RVX&VAX[]=SMALL&VAX[]=SMALLMNK&VAX[]=SSEV&VAX[]=TBE&VAX[]=TD&VAX[]=TDAP&VAX[]=TDAPIPV&VAX[]=TTOX&VAX[]=TYP&VAX[]=UNK&VAX[]=VARCEL&VAX[]=VARZOS&VAX[]=YF&WhichAge=range&LOWAGE=&HIGHAGE=&VAX_YEAR_HIGH=2020&VAX_MONTH_HIGH=11]Source.)
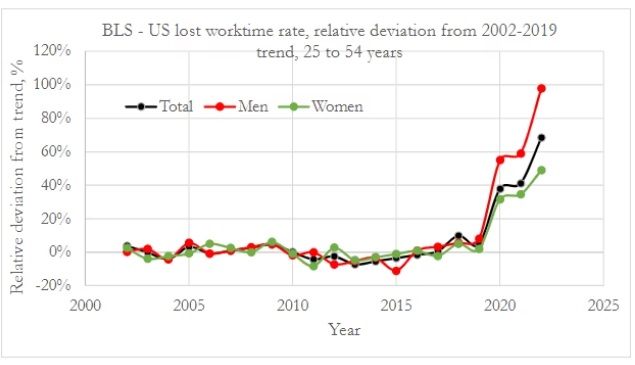
Image source.
As Edward Dowd pointed out in the chart above, the lost worktime rate for men in the U.S. has increased 100% today.
Those who do not take into account the deaths, injuries, and disabilities following COVID shots are really not in a very good position to accurately explain the current workforce in the U.S. today and how it impacts the economy.
Just from a macro perspective, a sick population and and a sick workforce means less production, and increased consumption, primarily consumption of “healthcare” (which is more accurately called “sickcare”) products and services.
And that spells disaster for the U.S. economy.
MORE HERE: https://healthimpactnews.com/2023/the-data-missing-from-wall-street-economists-skyrocketing-disabilities-and-injuries-in-u-s-workforce-after-covid-19-vaccines/


 Sat Mar 23, 2024 11:33 pm by globalturbo

